
- Create a file named as, showHeapSize.py and add the following code than save and exit:
serverJVM=AdminControl.completeObjectName('type=JVM,process=' + sys.argv[0] + ',*') serverJVMObj=AdminControl.makeObjectName(serverJVM) perf=AdminControl.completeObjectName('type=Perf,process=' + sys.argv[0] + ',*') perfObj=AdminControl.makeObjectName(perf) jvmObj=AdminControl.invoke_jmx(perfObj,'getStatsObject',[serverJVMObj,java.lang.Boolean('false')],['javax.management.ObjectName','java.lang.Boolean']) currentHeapsize=jvmObj.getStatistic('HeapSize').getCurrent() usedMemory=jvmObj.getStatistic('UsedMemory').getCount() usage=float(usedMemory)/float(currentHeapsize)*100 print sys.argv[0] + ".> "+str(currentHeapsize)+"K .> "+str(usedMemory)+"K .> "+"Usage:%.2f" % usage+"%"
- Place the above file to directory /opt/jars/
- Create a new file named heap.sh, paste the below lines (modify according to your environment), and place to /opt/scripts/ directory.
echo "WAS Profile 1 Start" /opt/WAS9/IBM/WebSphere/AppServer/bin/wsadmin.sh -lang jython -f /opt/jars/showHeapSize.py server1 -username wasadmin -password password; echo "WAS Profile 1 End" echo "WAS Profile 2 Start" /opt/WAS9/IBM/WebSphere/AppServer/profiles/AppSrv02/bin/wsadmin.sh -lang jython -f /opt/jars/showHeapSize.py server1 -username wasadmin -password password; echo "WAS Profile 2 End"
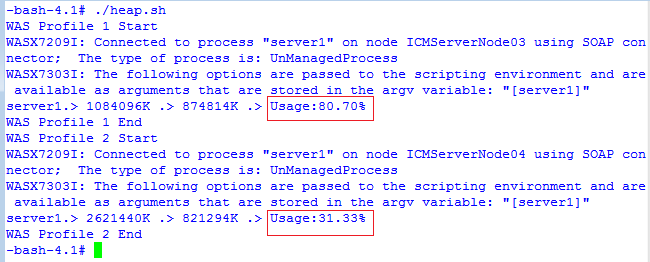
- Run the script from terminal. JVM websphere application server results will be displayed as mentioned below:
 Download sample code here.
Its just an example. You can create your own folder where it is accessible either in /opt or somewhere else.