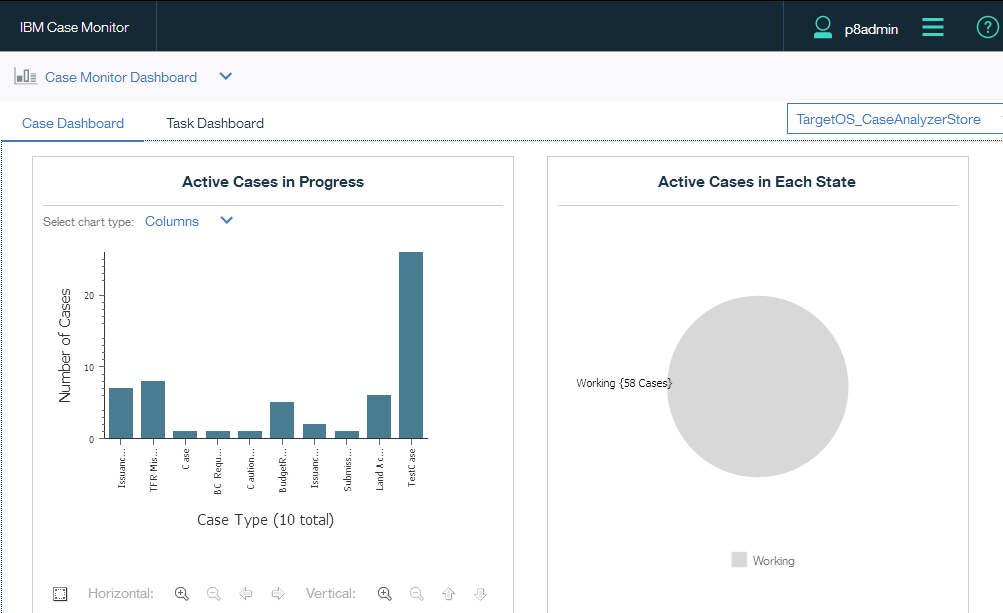
One can use the IBM Case Monitor Dashboard to view of business activities data that is specific to case management systems. This dashboard, which is an IBM Content Navigator desktop provides a dashboard that displays widgets that show case and task activity across solutions. You can use this data to review volume, find and eliminate bottlenecks, and ensure that operations are working efficiently and effectively.
The IBM Case Monitor Dashboard retrieves data for the solutions that are deployed to a target object store from the Case Analyzer store that you configure for that object store. In the dashboard, users can switch between Case Analyzer stores to obtain information about solutions in different target object stores.
Note: By default, any user who has access to the target object store has access to the IBM Case Monitor Dashboard.
To configure IBM Case Monitor Dashboard, you need to perform following tasks accordingly:
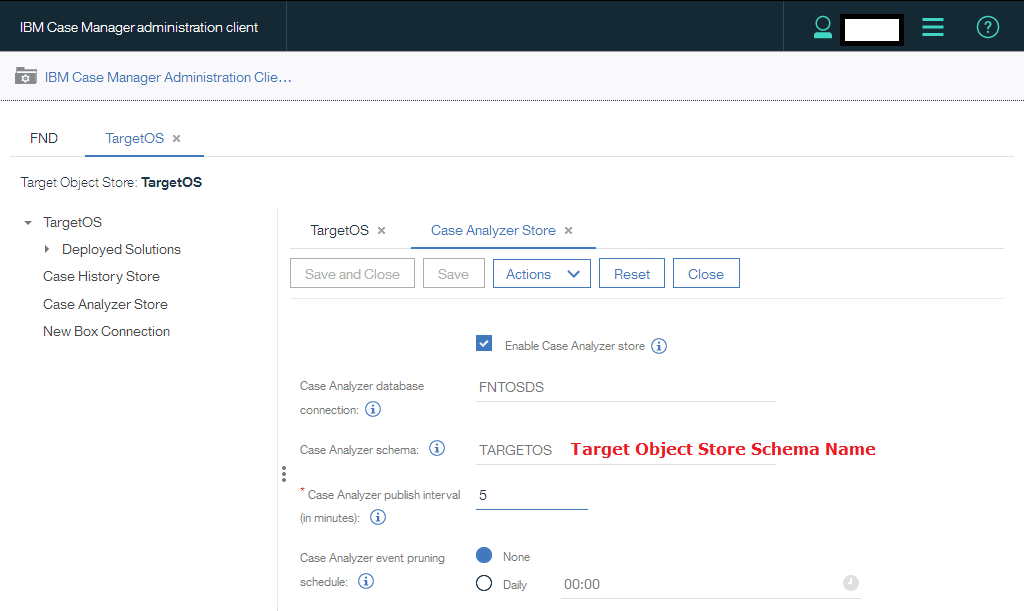
- Prepare the database for the Case Analyzer store. You enter the database schema name when you configure and enable the Case Analyzer store by using the IBM Case Manager administration client.
- Create the Case Analyzer store:
- Log in to the IBM Case Manager administration client.
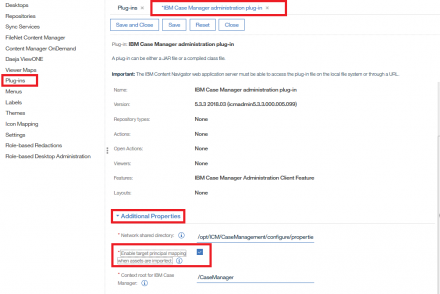
- Under the domain, expand Object Stores and click the target object store in which you want to create the Case Analyzer store.
- Click New Case Analyzer Store and enter the information for the new store.
3. Log in to the IBM Case Manager configuration tool and run the Register the Case Monitor Widgets Package task to add the IBM Case Monitor Dashboard desktop to IBM Content Navigator.
Once performed all of these steps while ICM installing or upgrading, try to add and process few test cases using ICM Client desktop and check after sometime either data is fetching or not. First of all data will be fetched successfully into Case Monitor Dashboard charts but in case of “no data is available for this chart“, you need to perform step 2 again.
- Delete Case Analyzer Store using icmadmin desktop for target object store.
- Recreate Case Analyzer Store by providing relevant data source and schema information.
After that, check the data using http://servername:9081/navigator?desktop=icmmonitor desktop. Data will be available for all of the relevant charts according to cases working in ICM Client as shown below:
Further details, please go to following IBM recommended Knowledge Center & tech note:
2 Comments
Hey hi,
I just wanted to know whether we can customize the case monitor interface, so that we can show charts based on some conditions like for a specific application.
Like I want to show no of failed, created, completed cases for a complain mgmt solution.
Any help will be highly appreciated!! thanks in advance.
Hi Aditya,
This is default plugin which comes with 5.3.3.x version. One option is to customize this plugin or create your own to achieve your requirement, second option is to implement IBM Cognos BI or Crystal reports to fully analyze all of the triggers, and third option is to make a query for failed, created, or completed cases from EVENT table of target object store and show separately in a web page. I’ve generated an email notification when any of task failed in ICM using event table. Let me know if more details required, please. Thanks.